
ROAS doesn’t move because of one trick — it moves because you’re spending on the right audience, with the right creative, tracked correctly. Here’s exactly what it means, how to calculate it, and what actually raises it.

What Does ROAS Mean?
ROAS stands for Return on Ad Spend. It measures how much revenue your business earns for every dollar (or rupee, taka, euro — any currency) spent on advertising.
If you spend $1,000 on ads and those ads generate $4,000 in revenue, your ratio is 4:1, or 400%. Both notations mean the same thing — for every $1 spent, $4 came back in revenue.
It’s used across every major paid channel: Google Ads, Meta Ads (Facebook/Instagram), TikTok Ads, Amazon Ads, LinkedIn Ads, and programmatic display. It’s channel-agnostic, which is part of why it’s become the default health-check metric for paid media.
The ROAS Formula
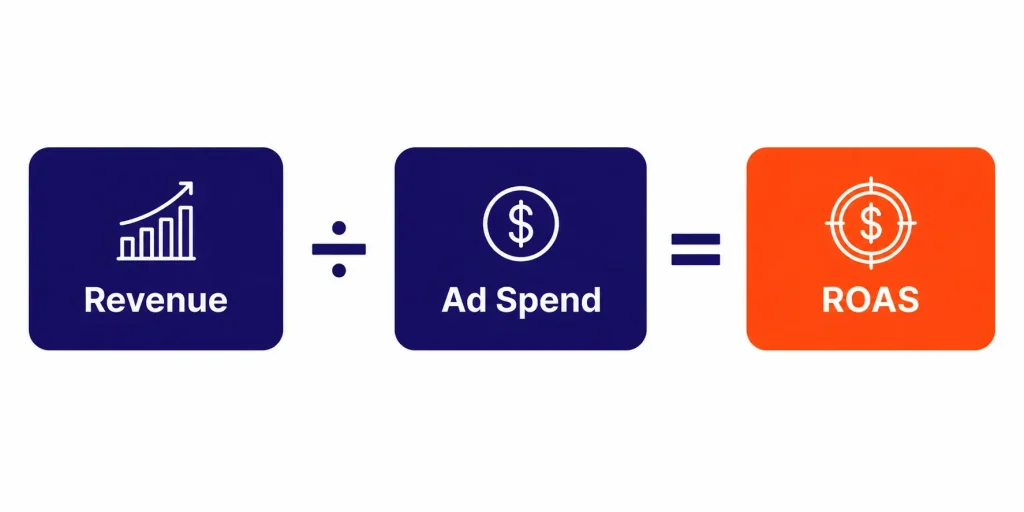
ROAS = Revenue ÷ Ad Spend
ROAS = Revenue ÷ Ad Spend
That’s the entire formula. No hidden variables, no adjustments — just revenue divided by what you spent to generate it.
Worked Example
Let’s say an online store runs a Facebook ad campaign for a month:
- Ad Spend: $2,500
- Revenue attributed to the campaign: $11,250
ROAS = $11,250 ÷ $2,500 = 4.5
This campaign has a ROAS of 4.5:1, meaning every dollar spent on ads returned $4.50 in revenue. As a percentage: 4.5 × 100 = 450%.
Skip the manual math — use the free ROAS Calculator to get your ratio, percentage, and profit instantly.
Why Marketers Rely on ROAS
- It’s fast to calculate. You only need two numbers — spend and revenue — both already sitting in your ad platform’s dashboard.
- It’s directly tied to money in and money out. Unlike softer engagement metrics, it answers the exact question a finance team or business owner is going to ask: did this spend pay for itself?
- It’s granular. You can calculate it at the account, campaign, ad set, or even keyword level — useful for deciding exactly where to shift budget.
Because it’s so central to paid media, most major platforms let you bid directly toward it. Google Ads, for example, offers a dedicated Target ROAS bidding strategy that automatically adjusts bids to hit a revenue goal you set.
What Is a Good ROAS? (Benchmarks by Context)
There is no single “correct” number that applies to every business — it depends heavily on your profit margins, average order value, and business model.
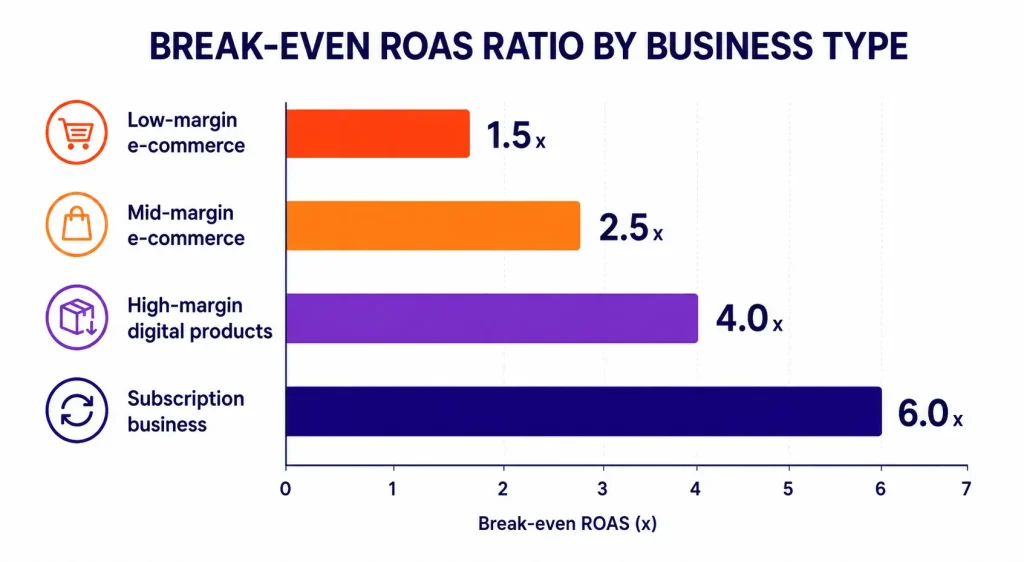
| Business Type | Typical Break- Even ROAS |
Why |
|---|---|---|
| Low-margin e-commerce (e.g., 20% margin) |
5:1 or higher | Thin margins need more revenue per ad dollar just to cover costs |
| Mid-margin e-commerce (e.g., 40-50% margin) |
2:1 to 3:1 | More room to be profitable at a lower ratio |
| High-margin digital products / SaaS |
1.5:1 to 2:1 | Minimal product cost means most revenue is profit |
| Subscription businesses (measuring LTV) |
Can be profitable below 2:1 |
Customer value compounds over multiple billing cycles |
The most reliable benchmark isn’t an industry average — it’s your own break-even ratio, calculated from your actual margins (Break-Even ROAS = 1 ÷ Profit Margin).
ROAS vs. ROI: What’s the Difference?
| Metric | Formula | What It Captures |
|---|---|---|
| ROAS | Revenue ÷ Ad Spend | Only ad spend vs. the revenue it generated |
| ROI | (Net Profit ÷ Total Investment) × 100 |
All costs — product, overhead, staff time, tools — vs. net profit |
It’s faster to check day-to-day. ROI gives the fuller profitability picture, since it accounts for everything else that goes into running the campaign, not just the media spend.
How to Calculate ROAS Step by Step
- Pick your time period and scope — a single ad, an ad set, a full campaign, or the entire account.
- Pull your total ad spend for that scope and period.
- Pull your total attributed revenue for the same scope and period, with conversion tracking set up correctly.
- Divide revenue by spend. That’s your ratio.
- Multiply by 100 if you want the percentage form.
Common Mistakes When Measuring ROAS
- Using the wrong attribution window. A 7-day click window shows different revenue than a 28-day window — Meta, for instance, explains how its attribution windows affect which conversions get credited to an ad.
- Ignoring return/refund rates. High refund rates mean your “true” number is lower than the dashboard shows.
- Comparing performance across very different campaign types — brand awareness vs. retargeting will naturally differ.
- Treating platform-reported numbers as gospel. Cross-check against your own analytics periodically.
How to Improve Your ROAS
- Tighten your targeting toward audiences with a proven history of converting.
- Test creative systematically — one variable at a time.
- Fix your landing page, not just your ad.
- Switch to value-based bidding where your platform supports it.
- Cut your worst-performing segments and reallocate that budget.
- Raise average order value through bundling and upsells.
How We Can Help
Improving it is really a subset of good campaign management — the same targeting, creative testing, and tracking work covered in our marketing services is what drives this metric up sustainably. If you’d rather not manage the testing and optimization yourself, we handle it end-to-end. For a quick self-check right now, the free ROAS Calculator takes 10 seconds and needs no sign-up.
Frequently Asked Questions
Is a higher ROAS always better?
Generally yes, but an extremely high number at very low spend can mean you’re under-investing in a channel that could scale profitably.
Does ROAS account for product costs?
No. It only compares ad spend to revenue. For profitability after product costs and overhead, calculate ROI instead.
Can ROAS be tracked per keyword?
Yes, most ad platforms show it at the keyword or ad level when conversion tracking is set up correctly.
What’s the difference between ROAS and CPA?
One measures revenue relative to spend. CPA measures spend relative to the number of conversions — two sides of the same coin.
Should I use ROAS or ROI to decide my marketing budget?
Use the former for fast, campaign-level tuning. Use ROI when deciding whether an entire strategy is worth continuing.
What’s a realistic first-month ROAS for a brand-new campaign?
Many campaigns see lower numbers in the first few weeks while the algorithm and creative are still optimizing. Give it 1–2 weeks of stable data before judging it harshly.
Want Help Improving Your ROAS?
Free 20-minute audit — we’ll show you exactly what’s holding your ad performance back.
Call +91 86172 54651 See SEO Services